


By Dr Stefan Haberstock
Fluorescence detection can give you the ability to develop assays with extreme sensitivity, high robustness and a broad dynamic range. Success involves addressing several challenges, such as the careful choice of excitation (Ex) and emission (Em) wavelengths and the selection of flexible and sensitive optics, as we will see here.
Optimizing fluorescence – maximizing signal, and minimizing background
As in any detection method, the key to success in fluorescence measurement is achieving high sensitivity through a high signal-to-noise (S/N) ratio. The S/N ratio of a specific measurement greatly depends on the excitation (Ex) and emission (Em) characteristics of the dye and the wavelength and bandwidths settings used.
Every fluorophore has its own Ex spectrum that defines which illuminating wavelength should be used to maximize excitation. In turn, the fluorophore’s Em spectrum decides at which wavelength the light emission is strongest. The difference between both optima (Ex & Em) is called the Stokes shift.

The Stokes shift is the basis for the high sensitivity of fluorescence detection
The Ex and Em wavelengths can be set exactly or close to the dyes optima using filters of the appropriate wavelength or monochromators that enable free wavelength selection. The precision with which the optimal wavelength can be selected depends on the bandwidth. For example, a monochromator with a bandwidth of 20nm that is set to a wavelength of 450nm will let light pass in the range 440–460nm.
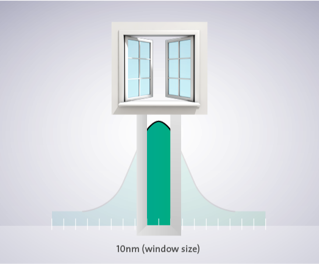
Bandwidth determines how precisely a wavelength can be selected. A bandwidth of 20nm indicates that at 50% height of the Gaussian curve, the wavelength will be +10nm, at the bottom of the curve the bandwidth will be even +20nm.
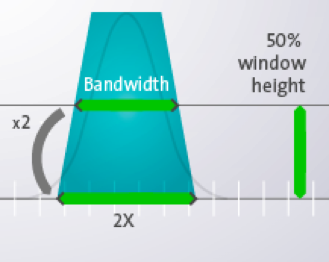
When a dye has a Stokes shift smaller than the sum of the bandwidth (Ex + Em) used, selecting the Ex and Em optima will lead to cross talk or overlap. This means that light used for Ex will pass the Em filter or monochromator and will reach the PMT, leading to false positive results.
Overlap of Ex and Em bandwidth leads to false positive
A narrow bandwidth might therefore appear to be preferable, since it always enables the Ex and Em optima to be selected, but reducing the bandwidth also lowers the energy input, detection limit and the S/N ratio. In most cases, a bandwidth of around 15 – 20nm on the Ex and the Em side with wavelength settings not centering on the Ex and Em optima gives best detection limits and S/N ratio.
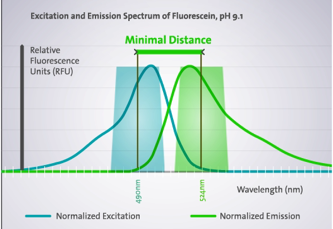
Wavelength settings with optimal distance (Ex + Em + 5nm) between Ex and Em bandwidth to inhibit overlap and yield best detection limit and S/N ratio.
The fluorophore is affected by its environment
The Ex and Em characteristics of a dye can be affected by molecules to which it is linked or associated with, and also the surrounding physical and chemical environment. Environmental factors include temperature, ionic strength, and pH. Optimizing an assay should therefore include determining the Ex and Em optima of a dye in the specific assay situation using monochromators to scan for Ex and Em.
Monochromators are usually less sensitive than filters, leading to a compromise on sensitivity during assay development. Usually only the Ex or the Em wavelength is scanned in a single measurement. An ideal optical solution would therefore allow combinations of a filter with a monochromator in the same measurement to either maximize dye excitation or emission recording via the filter.
Powerful multiplexing demands a powerful photomultiplier tube
As we saw in the previous article in this series, the ability to multiplex fluorescence assays can make fluorescence the technology of choice in many situations. But as we learned above, spectral overlap can kill sensitivity by introducing noise. In assays that use several dyes in one measurement (multiplexing) this is even more important and special attention needs to be paid on the dye selection. Due to the huge popularity of fluorescence technology many dyes and versions of fluorescent proteins are now available allowing us to use the full spectral range.
In this context, the spectral performance of the photomultiplier tube (PMT) becomes important. Many PMTs are optimized for fluorescein, which emits light in the green range around 500nm, but they struggle with dyes that emit in the red range above 600nm. This can lead to a significant reduction in sensitivity that demands compensating with higher concentrations of the reactants, which increases costs and lowers assay robustness. If you intend to perform multiplexed assays, you need to pay attention to the spectral response of the PMT.
In the next article, we will look at the specific challenges of developing cell-based fluorescence assays and how they can be overcome.
For more information, dowload the application note: Evaluation of the performance of the Spark® multimode reader for far red fluorescence emission.

About the author

Dr Stefan Haberstock
Dr Stefan Haberstock works as a sales development specialist for benchtop solutions at Tecan with over 5 years in experience in field marketing and supporting product launches. He studied Biology at Gutenberg University Mainz and Trinity College Dublin and received a PhD in Biochemistry from Goethe University Frankfurt am Main.