


By Michelle Aichele
Are you ignoring valuable information about laboratory instrument and consumables usage because it is too difficult or time-consuming to collect and analyze? Is the information managed in too many disparate places and not easy to collect? Or maybe you feel like your spreadsheet-based analytics solution is too labor-intensive and prone to errors?

Improve your business intelligence and step-up lab productivity with real-time equipment utilization analytics software.
The irony is that essential instrument utilization data is probably already being captured in equipment log files, but staff members are wasting time and energy trying to manage it manually. The good news is that laboratory utilization management software now exists that can automatically access log file data and analyze it for you. Here are some key factors to consider when deciding which solution is right for your lab.
Instrument usage analysis – the old-fashioned way
As we saw previously, analyzing lab equipment and consumables usage data can help you spot important trends and find new ways to improve productivity and cost-efficiency in your laboratory or manufacturing facility, but accessing and making sense of that information can be difficult.
Many labs still require equipment operators to manually record key information such as runtimes and protocol details. Obviously, manual workflows like these waste valuable time and are hard to maintain.
Moreover, when it comes time to analyzing the equipment utilization data, further manual steps are typically needed to collect all the information into a spreadsheet or statistical analysis package. At this point, you haven’t even started analyzing anything. Figuring out what metrics to analyze, how to visualize the results, and how to share them are not trivial matters – especially, if you don’t yet know what to focus on.
How to choose a laboratory analytics solution
Fortunately, there are a variety of equipment management tools available to help you automatically capture, analyze and interpret data about how instruments and consumables are being used in your laboratory or manufacturing facility. However, not all of these solutions are created equal. For example, some analytics packages look only at instrument utilization data. Others are designed to track consumables usage but are not capable of correlating that with instrument usage.
How do you choose a solution that fits the needs of your organization? Here are five important questions to ask when deciding on a prospective instrument utilization data analytics tool:
1. Does it offer real-time reporting?
Choosing solutions that give you access to consumables and instrument usage data in real time can be a significant step to reducing risk and increasing efficiency in the lab. Real-time information enables you to respond more rapidly to changing levels of productivity and spend. For instance, Introspect™ usage analytics software collects real-time data from Tecan Fluent® and Freedom EVO® systems for analysis in combination with historical data. Helpful graphics and statistics give you an instant picture of current usage in the context of historical patterns, providing the insight needed to troubleshoot processes, redeploy instruments and staff to maximize up time, spot cost-cutting opportunities, and more.
2. Will it facilitate instant connectivity?
Recent advances in cloud technology have been a big enabler for collection and analysis of usage data stored across multiple systems and locations. If you are (or expect to be) managing performance across many robotic systems and multiple sites, a secure cloud-based analytical system for lab management software is a good investment.
3. Is it secure?
Whether or not you go for cloud-based technology, it’s important to find a lab management software analytics solution that is secure, offers controlled access, and protects sensitive data. This allows you to capitalize on all the benefits the “internet of things” has to offer without worrying about security breaches and non-compliance with safety regulations. To ensure maximum security, suitable encryption protocols are a must. For example, Introspect software encrypts data transmissions using proven high-security connections, and includes obfuscation measures such as hexadecimal coding to ensure that the data in the cloud cannot be read. It is also possible to assign aliases to the data.
4. Are results easy to visualize and interpret?
The more usage data you collect, the more important top-notch visualization tools become. After all, if you can’t make sense of the data, it is worthless to you. For this reason, it can be a big advantage to choose an analytics solution that comes with a well-designed dashboard that displays all the information you need at a glance and offers the option to hide irrelevant data. If you share equipment utilization software across different labs and functions, the ability to customize the tools and displays to specific roles and users is important. For example, as a lab manager, you may need displays that help you review:
- Instrument usage as a percentage of working hours for a given timespan
- Error rate by instrument or method
- Run duration by operator or instrument
- Reagent consumption by method
- Total runtime per day
By contrast, your procurement or finance team may prefer to display different metrics.
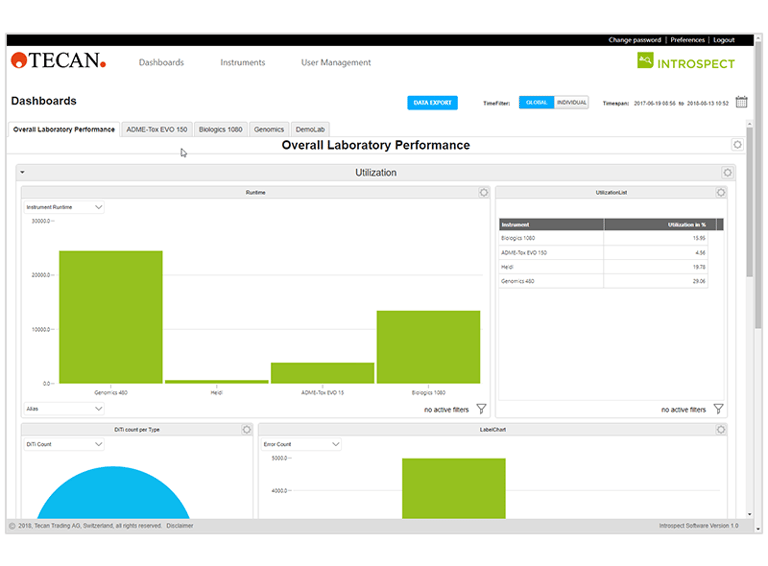 Introspect customizable dashboard gives you real-time actionable insights into how Tecan Fluent® and/or Freedom EVO® instruments and associated consumables are being used across your organization.
5. Will it let me put historical data to good use?
Archived data can give you tremendous insight into long-term trends and usage patterns. If you have been operating a lab for years, chances are you have already collected and stored a large amount of utilization data from a number of different instruments and robotic systems. When implementing a new analytics solution, you shouldn’t have to start “from scratch” and let all that valuable information go to waste. Instead, it makes sense to choose an analytics solution that is compatible with all the previous log files. Introspect analytics software allows seamless integration of all existing archived logs from Tecan Fluent and Freedom EVO systems, so you can instantly review and search for patterns in historical data as soon as the software has been installed. These long-term insights might be exactly what you need to spot performance optimization opportunities or provide more accurate quotes for new customers.
Maximize your lab’s potential with a little more introspection
Choosing an instrument utilization analytics solution with the right features can take your lab from “old school” to progressive in a single step. With instant access to real-time and historical usage patterns, Introspect analytics will help you get the most out of Tecan robotics, and discover new ways to improve productivity and cost-efficiency in research, clinical and manufacturing environments.
Want to learn more about what Introspect analytics can do for you? Check out our new tutorial.

Keywords:
About the author

Michelle Aichele
Michelle is product manager at Tecan Switzerland and has a background in clinical diagnostics automation and product management. Before she joined Tecan she worked as a biomedical scientist with focus on immunoassays and hematology. This allowed her to gain experience in clinical laboratory automation and she became passionate on development automation workflows with Tecan instruments and software. She joined Tecan in 2007 and is now responsible for automation software product management.